

As of September 2025, Looker Studio doesn’t let you create annotations directly on charts.
Annotations are super useful for marking key events, issues, or anything you want to keep visible in a time series.
They work great in SEO dashboards or Google Analytics reports.
In Google Analytics 4, annotations are possible. In Google Search Console, you can add them using tools like Make it tool.
I don’t know if Google will add annotations to Looker Studio dashboards in the future (hopefully yes), but for now, we need a more “manual” way to do it.
The good news: it’s possible by combining data sources.
And yes—you’ll also need a Google Sheet.
Don’t worry, I’ll walk you through step by step.
👉Check out our selection of Looker Studio templates
Step 1: Create a Google Sheet
In the spreadsheet, add each annotation or milestone as a row.
One row = one annotation.
You can update this Google Sheet anytime, and since it’s connected to Looker Studio, your dashboard will update automatically when you add or edit rows.
In this example, there are 2 columns:
- Date
- Annotation
I’m using Google updates for SEO as annotations, but you can use it for anything.

Important:
The second column (Annotation) must be formatted as Text.
The first column (Date) must be formatted as Date.
Step 2: Add Data Sources to Looker Studio
In the report where you want annotations:
- Add the Google Sheets source (the one you just created).
- Add the main data source you want to annotate (Google Search Console, GA4, Google Ads, etc.).
Use the native Google Sheets connector, and make sure your fields are set as Date and Text.

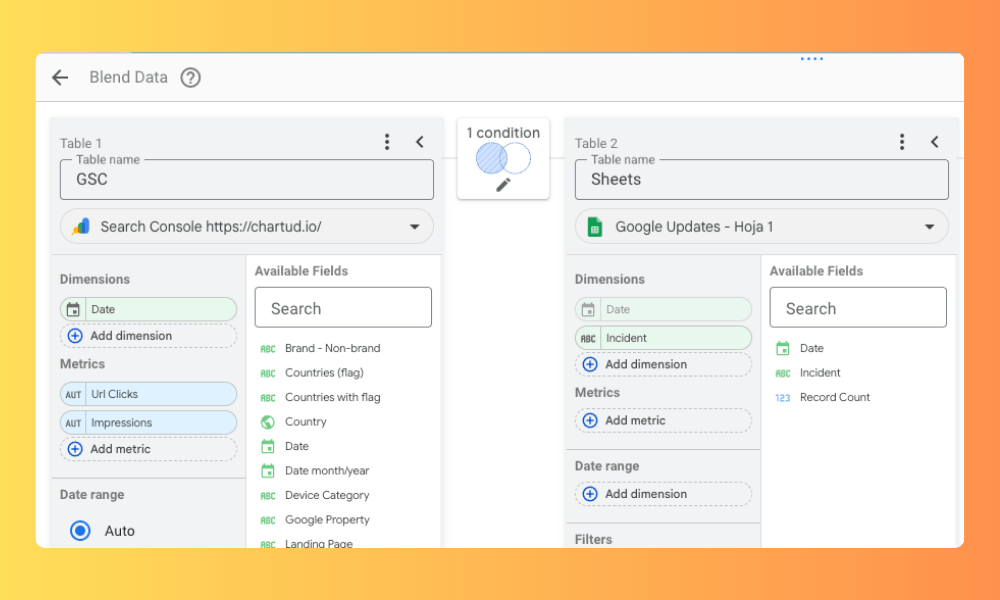
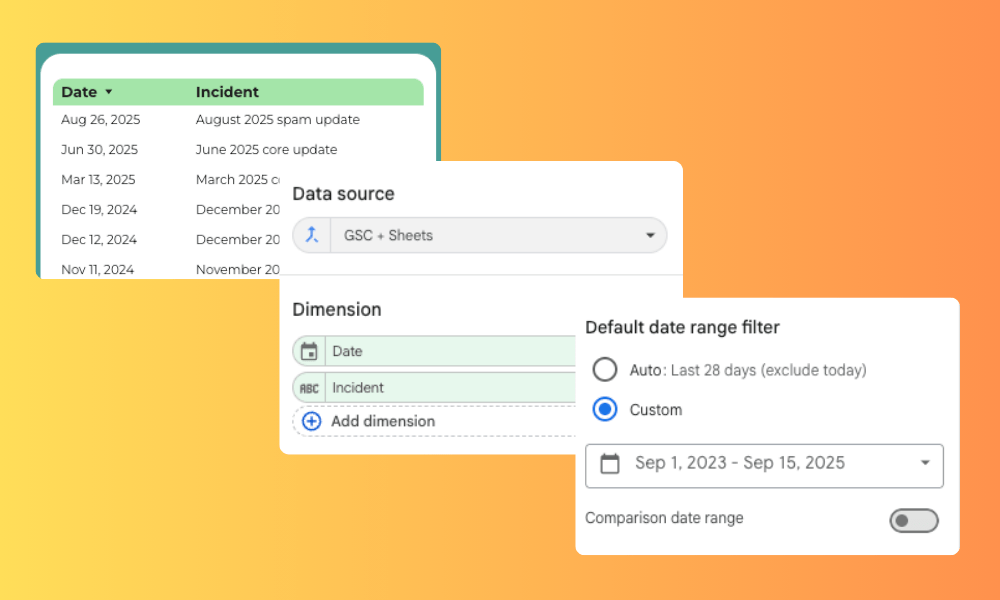
Step 3: Create a Data Blend
Go to Resource > Manage blends > Add a blend.
Your blend should look like this:
- Table 1: Main data source (GA4, GSC, etc.)
- Dimension: Date
- Metrics: Clicks, Impressions, Sessions, etc.
- Table 2: Google Sheets source
- Dimensions: Date and Annotation (here called “Incident”).
Set the join condition to match Date on both tables.
Choose “Left outer” as the join type.
Name the blended data source and save it.
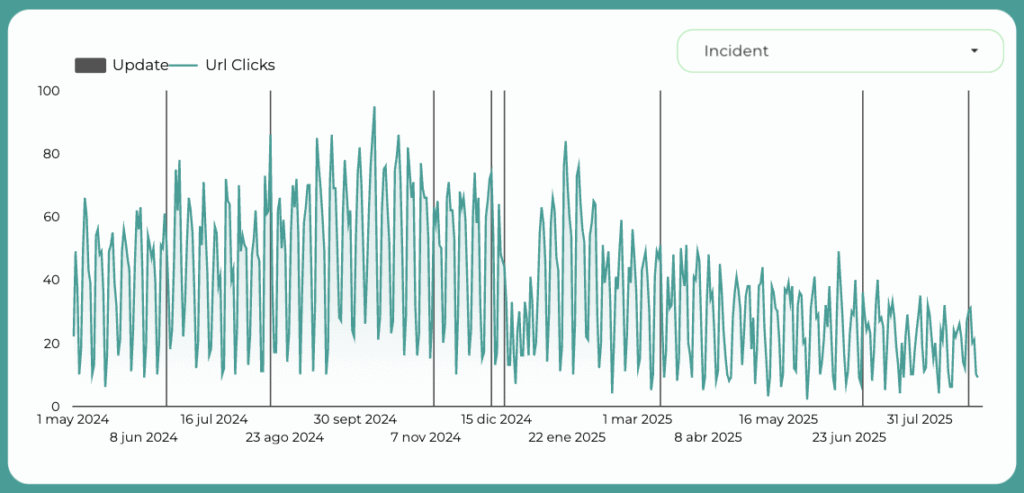
Step 4: Build the Chart with Annotations
Now add a time series (line chart).
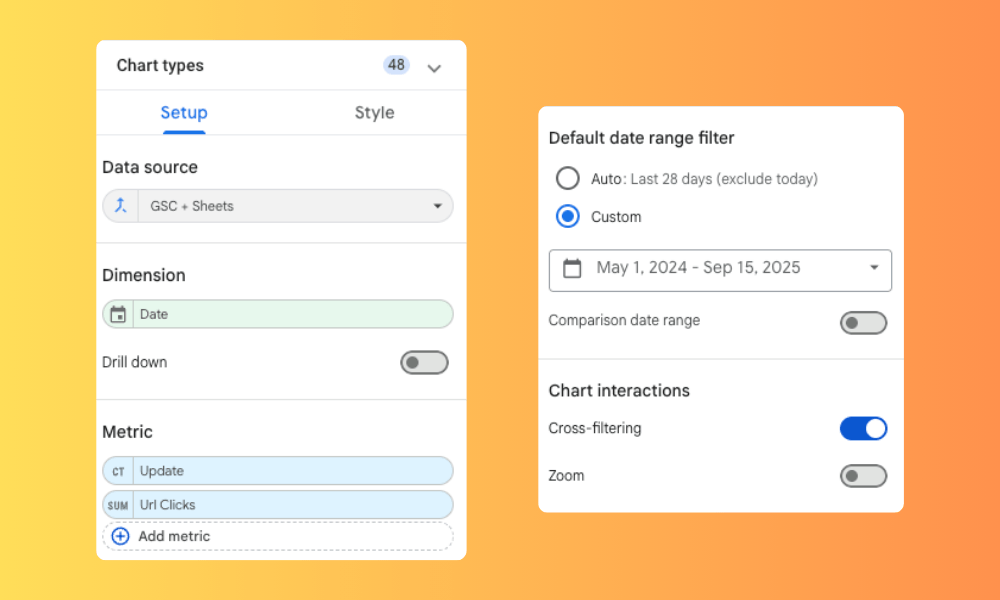
Settings:
- Data source: the blended one you created
- Dimension: Date
- Metric 1: the metric you want to analyze (Clicks, Sessions, Conversions, etc.)
- Metric 2: your annotation field (“Incidents” → renamed “Updates”)
- Date range: e.g. last 16 months for GSC history
- Interactive charts: turn on “Cross-filtering”
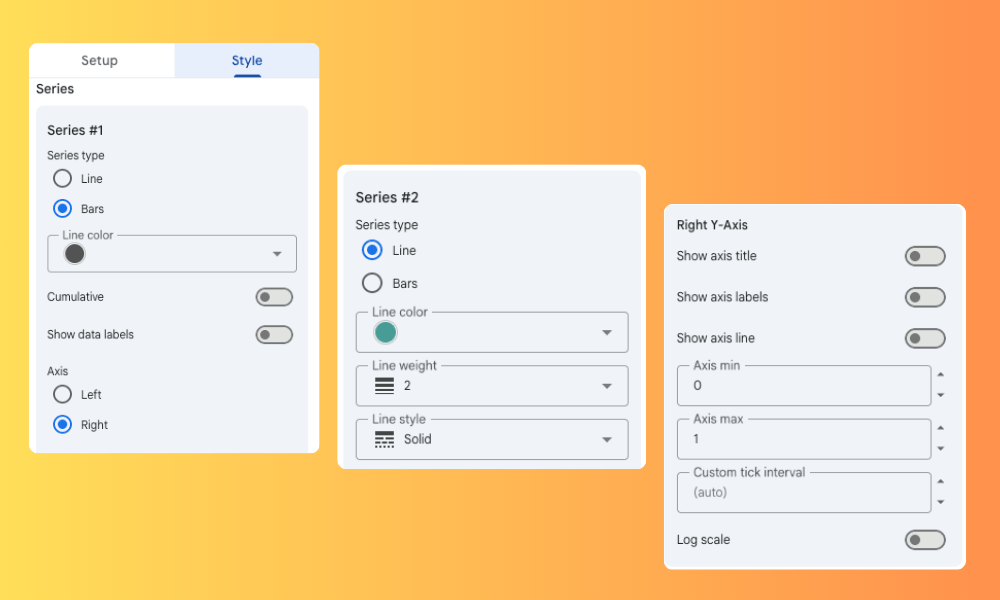
Style tab:
- Main metric (Clicks, Sessions, etc.) → Line, left axis
- Annotations metric → Bar, right axis
- Right Y-axis: min = 0, max = 1 (so bars always fill the height)
Now you’ll see both metrics: line + annotation bars.
Step 5: Create a Table for Annotations
Let’s add a table to make analysis easier.
The table has 2 columns (dimensions):
- Date
- Annotation (“Update” or “Incident”)
Apply the same date range as your chart.
Enable “Cross-filtering.”
By default, the table will also show rows with “null” (dates without annotations).
To fix that, add a filter:
- Exclude → Annotation dimension → is null
Now only rows with actual annotations will show.

Step 6: Make Charts & Tables Interact
Since you turned on Cross-filtering, you can:
- Click an annotation bar in the chart → table filters to that annotation.
- Click an annotation row in the table → chart filters to that annotation.
This makes analysis much easier.
Step 7: Add a Dropdown Filter

Now you have interactive time series charts and tables with annotations.
Whenever you want to add new ones, just edit the Google Sheet—your Looker Studio dashboard will update in seconds.


Alex Serrano
12 años en marketing digital. Creador de Chartud y especialista en Looker Studio. Consultor SEO desde hace 8 años. Creador y divulgador de contenido en diferentes formatos como 300Segundos (newsletter) o SEOdesdeCero (podcast). También cofundador de RankPulse.app, herramienta de SEO Local.