
")
")
")
")
")
")
")
")
")
")
Description
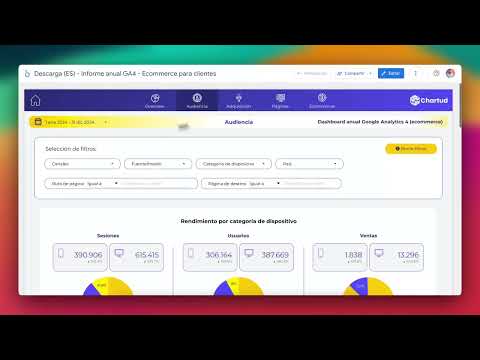
This report focused on online stores has 6 pages with data from the previous year and shows comparisons in many graphs with the previous year. It contains text fields and a cover page to include conclusions, perfect for reporting to clients.
All pages have controls to filter by channel, source/media, device category, country, page path and landing page.
Report pages:
- Cover page: contains a text field prepared to summarize the report with the main data and conclusions.
- Overview:
- Key metrics including, among others, transactions, revenue and conversion rate.
- Annual evolution of sessions, users, transactions and views.
- Performance by month.
- Distribution of users by channels and months of the year.
- Detailed performance of channels by months of the year.
- Top 10 pages
- Top 10 landing pages
- Audience
- Performance by device category: detail of sessions, users and transactions.
- Demographic data for the year: performance by sex and age ranges.
- Geographical data for the year: performance by country.
- Performance by type of user (new/recurrent) and evolution of each one during the year.
- Acquisition
- This page contains channel buttons. Clicking them filters the page.
- Key acquisition metrics.
- Evolution of sessions, users and transactions.
- Performance by channel – time evolution and table.
- Performance by source and medium, with the ability to link to landing page.
- Performance per campaign last year.
- Pages
- Key page performance metrics.
- Performance per page.
- Performance per landing page.
- Top 5 most viewed landing pages.
- Top 5 landing pages with the most transactions.
- Pages that have improved over the previous year (with combined data and custom fields).
- Pages that have deteriorated from the previous year (with combined data and custom fields).
- E-commerce
- Additional controls to filter by product name, category and/or brand.
- Key metrics: transactions, total revenue, conversion rate, items purchased, viewed and average revenue per purchase.
- Evolution of transactions and conversion rate throughout the year.
- Transactions by device, channel, country, gender and age.
- Yield per item.
Difficulty in adapting the template
Simple. You will only need to connect your Google Analytics 4 data.
Colors and logo can be easily customized.


