Description
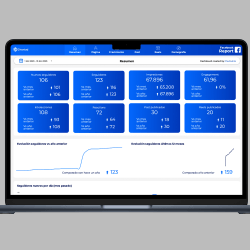
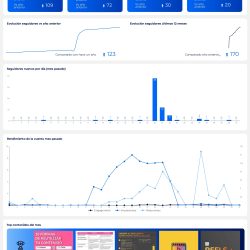
Page 1: Summary
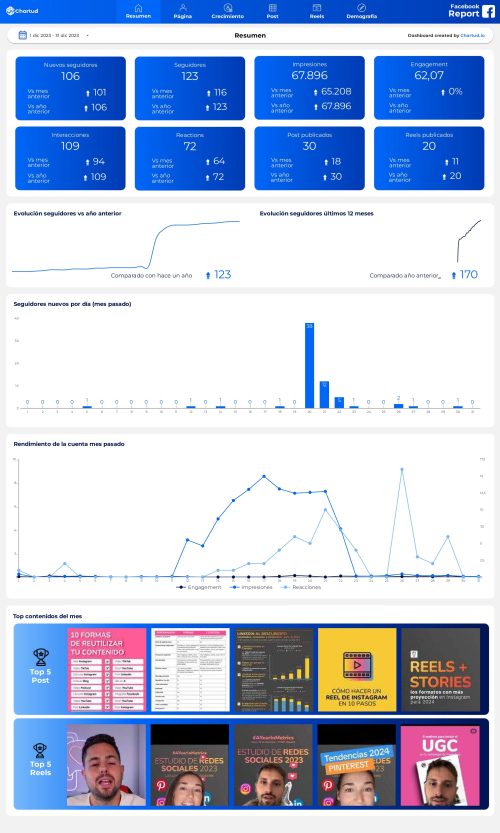
- Main page metrics compared to the previous month and the previous year.
- Evolution of followers in the past month with the data compared to the same month of the previous year
- Evolution of followers in the last 12 months compared to the previous year
- New followers per day last month
- Account performance per day in the past month: engagement, impressions, reactions
- Top 5 contents of the month: Post and Reels. Clickable to go directly to the publication.
Page 2: Page
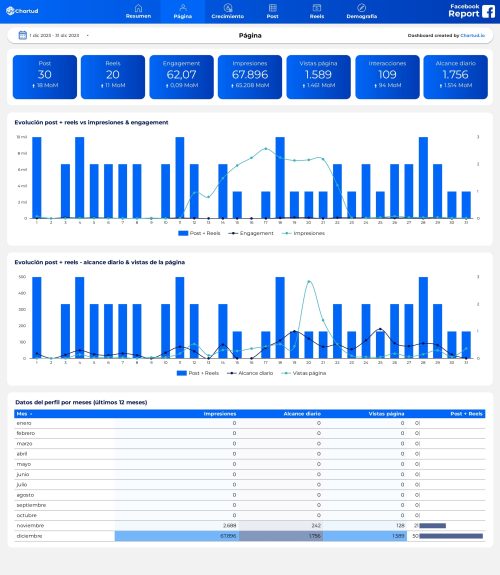
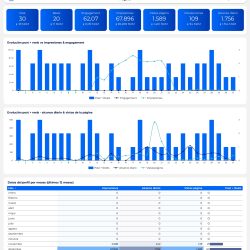
- Metrics compared to previous month: published posts and reels, engagement, impressions, page views, interactions, daily reach.
- Relationship between post & reels with impressions and engagement in the last month.
- Ratio between post & reels published with daily reach and page views in the last month.
- Table with account performance data by month: impressions, daily reach, page views and total posts (You can choose the period to analyze from the table, e.g. current year or last 12 months).
Page 3: Growth
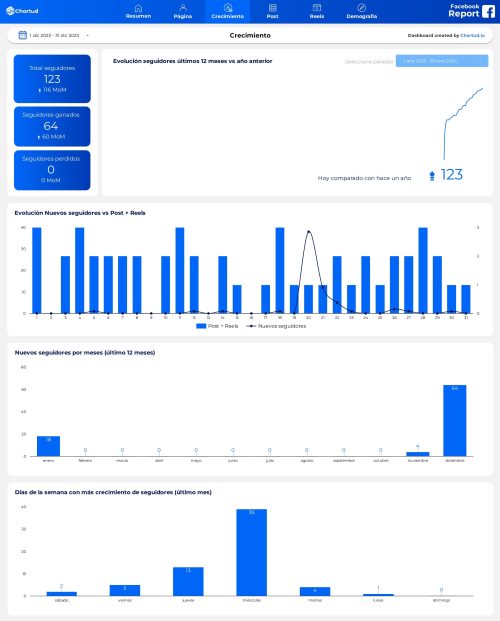
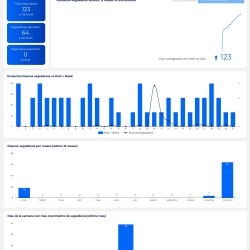
- Metrics compared to the previous month: total followers, followers gained, followers lost.
- Trackers evolution in time graph with today’s data compared to one year ago. It incorporates an individual period selector to change when needed the date to analyze.
- Ratio of new followers per day & post + reels published in the previous month.
- New followers per month.
- Days of the week with the highest follower growth in the past month.
Page 4: Posts
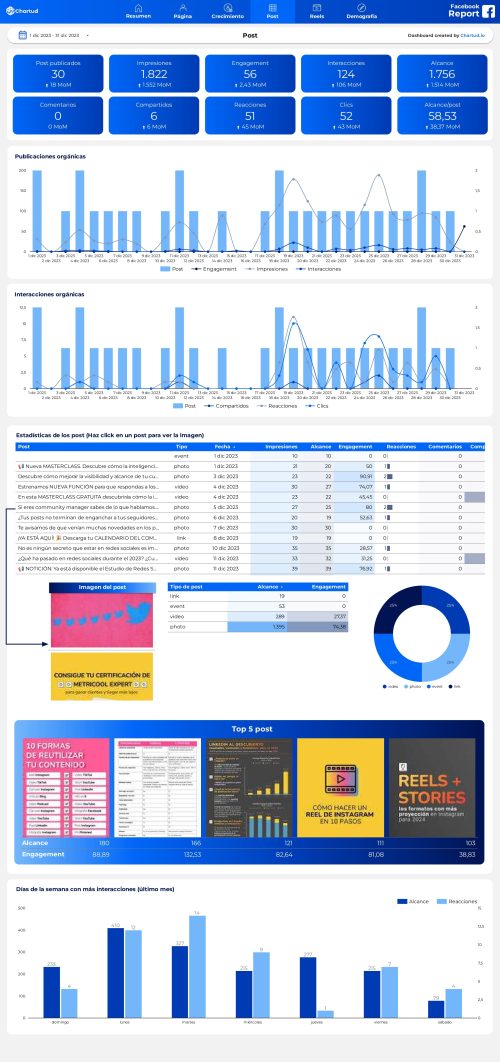
- Key metrics related to the performance of posts compared to the previous month.
- Performance of publications per day: engagement, impressions and interactions and posts published.
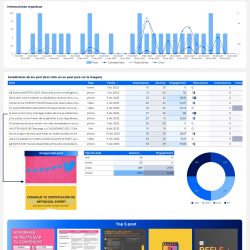
- Organic interactions per day: shares, reactions and clicks on publications.
- Table with the data of the previous month’s posts: type of post, publication date, impressions, reach, engagement, reactions, comments, shares.
- This table allows you to click on a publication and see the image of the publication.
- Table with the types of publications and their engagement and reach data to know which type of publication has the best performance.
- Pie chart showing the number of publications of each type in the previous month.
- Top 5 posts of the month, sorted by reach and engagement.
- Days of the week with more interactions and reach in the last month in posts.
Page 5: Reels
- Key metrics related to the performance of the Reels compared to the previous month.
- Reel performance per day: engagement, reach and interactions and published Reels.
- Organic interactions per day on Reels: comments, likes and video views.
- Table with the data of the previous month’s Reels: publication date, type, reach, engagement, likes, comments, video views.
- This table allows you to click on a Reel and see the thumbnail.
- Top 5 Reels of the month, ranked by reach and engagement.
- Days of the week with the most interactions in the past month on Reels.
Page 6: Demographics
- Distribution of followers by gender
- Distribution of followers by age
- Distribution of followers by country in table and pie chart
- Distribution of followers by city in table and pie chart
Difficulty in adapting the template
Adapt the template in less than 2 minutes to your data.
Colors and logo can be easily customized. You can change the metrics and dimensions you need whenever you want, delete or add new graphs easily.

