Description
Report pages:
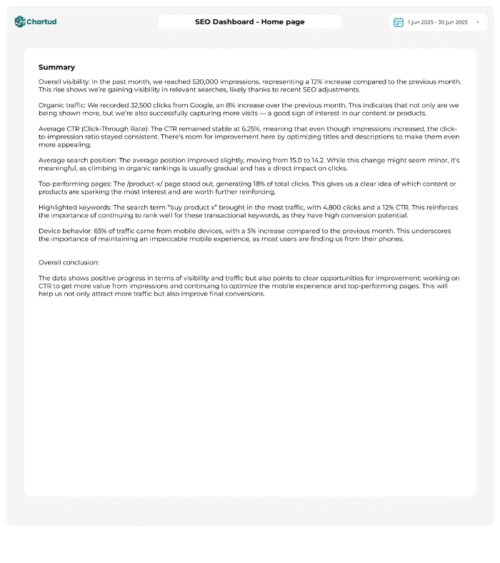
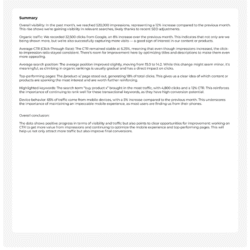
- Page 1 – Cover page: page with space to include conclusions of the report.
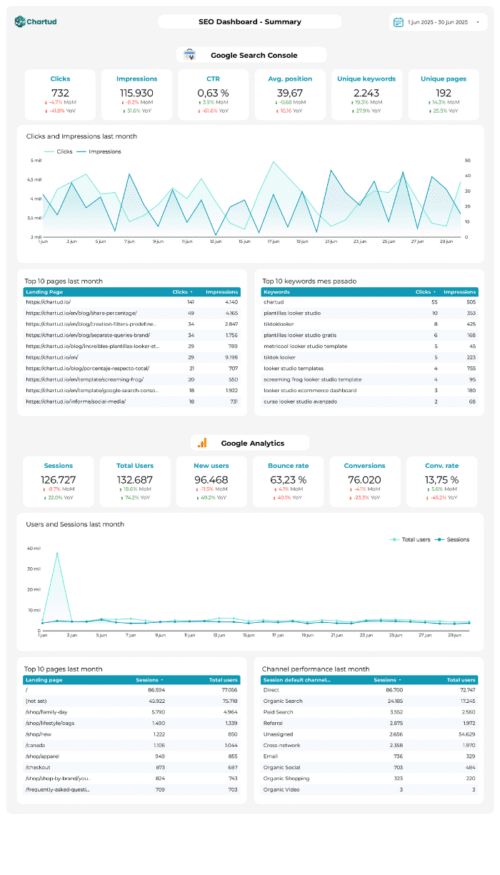
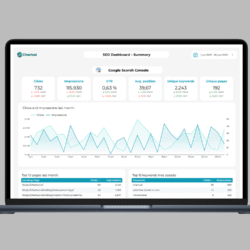
- Page 2: Summary
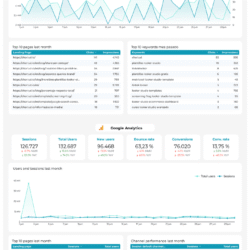
- Relevant GA4 metrics compared to the previous period and the same period of the previous year. Sessions, Users, New users, conversions, conversion rate and bounce rate.
- Evolution of users per day in the previous month compared to the previous period. You can choose other optional metrics such as Sessions and Conversions.
- Top 10 landing pages
- Top 5 traffic acquisition channels
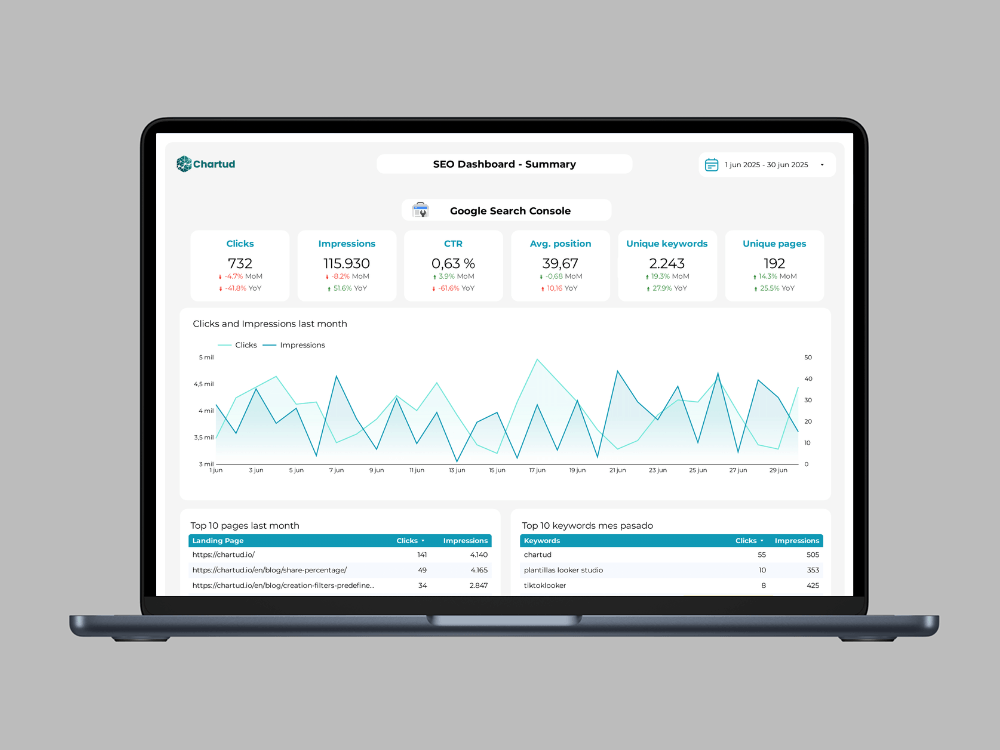
- GSC metrics compared to prior period and prior year: clicks, impressions, CTR, average position, unique keywords, unique pages
- Evolution of clicks and impressions per day, previous month
- Top 10 pages previous month
- Top 10 keywords previous month
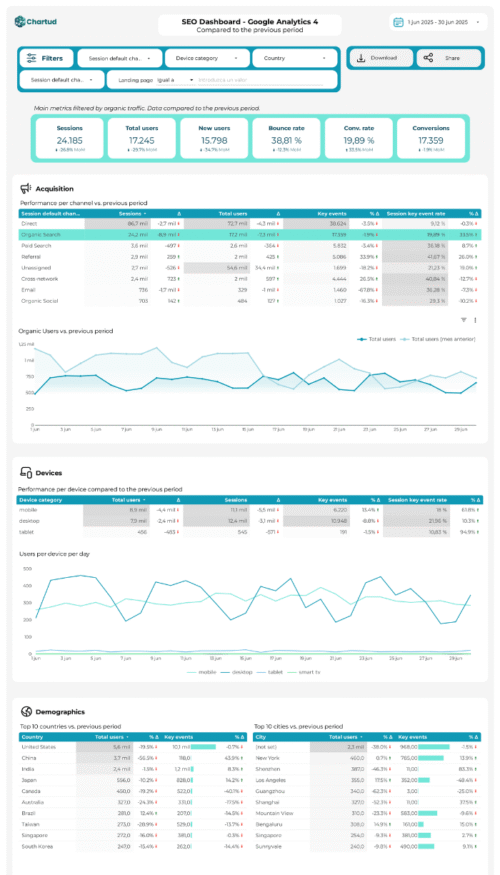
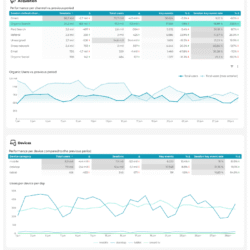
- Page 3: Google Analytics MoM (data compared to previous period)
- Controls for filtering data by country, device category, acquisition channel, source/media, landing page or page path
- Overall metrics compared to previous period: users, sessions, bounce rate, new users, views, average duration, conversion rate and conversions.
- Acquisition: table with detailed performance by acquisition channel, time series with users per day on each channel
- Devices: table detailing performance by device category, time series with users per day and device
- Demographics: tables with Top 10 countries and Top 10 cities. You can click on a country to see the cities of that country. Users and conversions by gender. Users and conversions by age range.
- Pages: landing page performance details
- Conversions: evolution per day of conversions and events with the average as a reference line. Table with the performance of the events with the highest number of achievements.
- Page 4: Google Analytics (data compared to the same period of the previous year)
- Controls for filtering data by country, device category, acquisition channel, source/media, landing page or page path
- Overall metrics compared to previous period: users, sessions, bounce rate, new users, views, average duration, conversion rate and conversions.
- Acquisition: table with detailed performance by acquisition channel, time series with users per day on each channel
- Devices: table detailing performance by device category, time series with users per day and device
- Demographics: tables with Top 10 countries and Top 10 cities. You can click on a country to see the cities of that country. Users and conversions by gender. Users and conversions by age range.
- Pages: landing page performance details
- Conversions: evolution per day of conversions and events with the average as a reference line. Table with the performance of the events with the highest number of achievements.
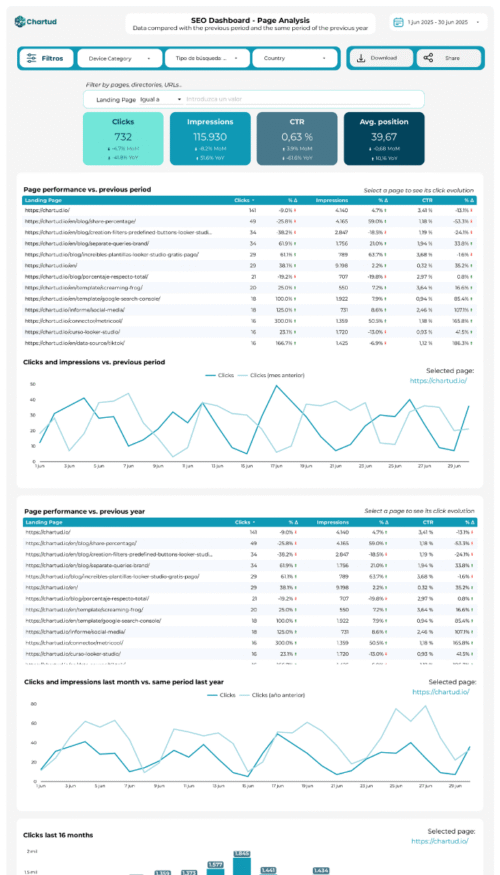
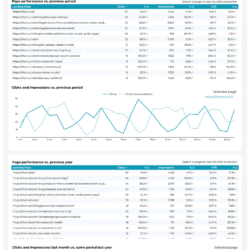
- Page 5 – Page analysis
- Control to filter by pages, group of URLs, directories…
- Metrics compared to previous period and previous year. Clicks, impressions, CTR and average position.
- Table detailing performance per page
- Evolution per day clicks according to the selected page
- Clicks in the last 16 months, global and according to the selected page
- Chart to know how to analyze the pages that receive more impressions and clicks and find opportunities
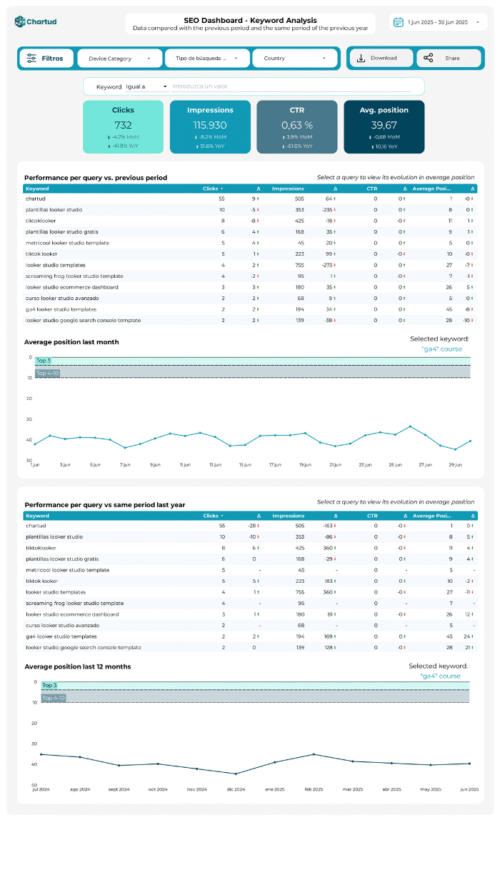
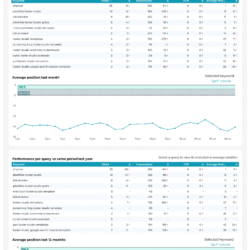
- Page 5 – Keyword analysis (data compared to the previous period):
- Control to filter by keyword, keyword group, brand and non-brand…
- Metrics compared to previous period and previous year. Clicks, impressions, CTR and average position.
- Table detailing performance by keyword
- Evolution of the average position according to the selected keyword per day, previous month
- Evolution of the average position according to the selected keyword per month, last 12 months
- Chart to know how to analyze the keywords that receive more impressions and clicks and find opportunities
Difficulty in adapting the template
Simple. You will only have to connect your Google Search Console and Google Analytics 4 data.
Colors and logo can be easily customized.
